
A scatter plot is a type of plot or graph that uses two coordinates axis (say x and y) to display values for two variables for a set of data.
We can use matplotlib library of python to create scatter plot in Jupyter notebook.
Let us import the required libraries first:
#Import the libraries
import matplotlib.pyplot as plt
import numpy as np
Then we need to generate some sample data for the plot.
# Create a sample data set of two variables x and y
x = np.linspace(5, 20, 50)
y = np.cos(x)
Finally as we have x and y variables and their corresponding data ready , let us create the plot.
#Draw Scatter Plot for x and y
plt.title("Scatter Plot")
plt.xlabel("Feature value")
plt.ylabel("Target Value")
plt.plot(x, y, '*', color='green')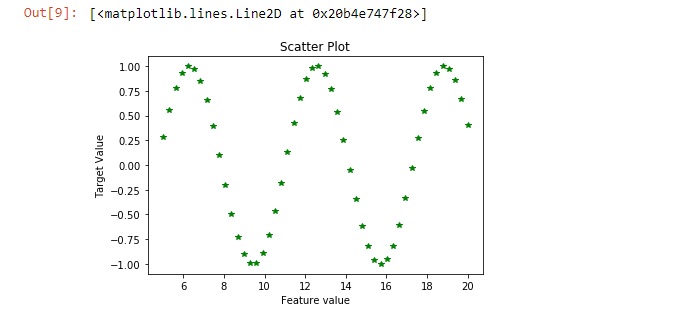
As you can see we got a scatter plot above for x and y using matplotlib
Happy coding !!
